Wednesday, February 28, 2024

The Chinese puzzle


                                        Chinese shoppers, look for the blue-light special. Photo: CTGN


In a few decades, China rose from the ranks of the poorest to the affluent. Its economy burgeoned ninefold from 1990 to 2022 (see Figure 1). One reason for this economic miracle is that the Chinese save like prophets.  Firms and governments borrow these abundant funds to build roads, dams, and factories. This expands China’s capacity to produce and thus its income. China adds far more value in manufacturing, as a share of its economy, than the typical country; see Figure 2.

Adjusting for inflation and changes in exchange rates, China has been the world’s largest economy since 2014.  Yes, I know that you hear from the news media that the US is still the largest economy. American reporters are economic illiterates, led astray by fluctuations in the exchange rate of renminbi per dollar.  These fluctuations have more to do with temporary rises and falls in money supply than with an economy’s long-run ability to produce.


Figure 1. China’s gross domestic product, 1990-2022, in 2017 international dollars.


Figure 2. Manufacturing value added, as a share of GDP, in China and the world, 2004-2021.


Just how much does China save? Over the long run, the typical Chinese spends just 55 cents of every international dollar earned; see Table 1. She saves the other 45 cents, either voluntarily or as tax payments, which are forced savings. In contrast, Americans spend more than four-fifths of an additional international dollar.  You would think that since Americans are richer than Chinese, they would save more of another dollar, because they have already met their essential needs. But that’s not the case. The Chinese save even more than Kazakhstanis.

(An “international dollar” is an artificial currency that expresses the cost everywhere of buying a good that would cost a dollar in the United States. By controlling for changes in the exchange rate, it expresses the same purchasing power everywhere. We thus avoid the mistake of thinking that an economy has grown in productive capacity merely because its exchange rate has strengthened for a few months.)


Table 1. China’s long-run consumption function, 1995-2022

R Square

1.000

Adjusted R Square

1.000

Standard Error

1E+11

Observations

28

ANOVA


Df

SS

MS

F

Significance F

Regression

1

1.81E+26

1.81E+26

17956.18

0.00

Residual

26

2.62E+23

1.01E+22

Total

27

1.81E+26


Coefficients

Standard Error

t Stat

P-value

Lower 95%

Upper 95%

Intercept

-6.6E+10

3.61E+10

-1.84

0.078

-1.4E+11

7.9E+09

GDP

0.547

0.004

134.0007

1.87E-38

0.539

0.555


Why do the Chinese save so much? Asians in general save in spades, but that hound don’t really hunt. It explains nothing.

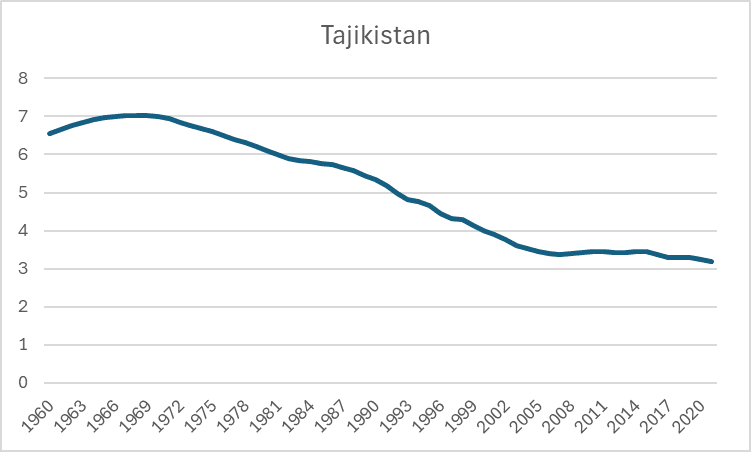
Maybe couples must save to raise those famously large families.  In the 1960s, a Chinese woman averaged more than seven births.  That was almost triple the number needed to keep the population from declining; see Figure 3.

But the fertility rate has been falling for decades.  This is thanks largely to China’s draconian policy in the 1970s to allow a couple to raise only one child, to defuse the then-dreaded Population Bomb. China today might like to have that Bomb back. Its population has just stabilized at 1.4 billion, and forecasts say it will even shrink; see Figure 4. In any event, Chinese families are getting smaller, so they don’t need bigger nest eggs.


Figure 3. The fertility rate in China, 1960-2021.


Figure 4. China’s population, 1960-2022.


Again: Why do the Chinese save? Maybe it’s to pay the taxes of a government that has been a Leviathan for centuries. People have gotten into the (forced) habit of saving for the rainy day, in a country where the government seems to rain every day. But even this explanation falls short, because China has been taxing lightly for at least two decades. The ratio of tax revenues to GDP is only about 8%; see Figure 5. The world average is almost double that. So why haven’t the Chinese loosened their belts in response to softer taxes? Maybe spending habits are hard to change. Which, of course, just begs the question.


Figure 5. Share of tax revenues in GDP, 2005-2021.


In the short run – up to a year – the Chinese spend slightly more of an international dollar than in the long run, probably out of necessity; see Table 2. But over time, they cut spending by 23 billion international dollars, when controlling for income. The Chinese indeed have a passion to save.


Table 2.  Short-run marginal propensity to consume in China, 1995-2022

R Square

1.00

Adjusted R Square

1.00

Standard Error

9.51E+10

Observations

28

ANOVA


df

SS

MS

F

Significance F

Regression

2

1.81E+26

9.03E+25

9985.716

0.00

Residual

25

2.26E+23

9.05E+21

Total

27

1.81E+26


Coefficients

Standard Error

t Stat

P-value

Lower 95%

Upper 95%

Intercept

-2.8E+10

3.93E+10

-0.716

0.481

-1.1E+11

5.28E+10

GDP

0.586

0.020

28.982

0.00

0.545

0.628

Time

-2.3E+10

1.16E+10

-1.978

0.059

-4.7E+10

9.48E+08


This is not always fortuitous. Central Asia would certainly prefer that the Chinese buy more imports. And the Chinese themselves may suffer from their frugality. For when the world economy slows, the Chinese must provide their own fuel to crank up their GDP engine. If they balk at spending, recovery may slow. In fact, at a hypothetical income of zero, there is no evidence that the Chinese would spend anything (see Table 2), even though they could probably borrow from future taxpayers by selling bonds to be paid off by hiking future taxes. The Chinese puzzle lives on. – Leon Taylor, Baltimore, tayloralmaty@gmail.com


Notes

For useful comments, I thank but do not implicate Annabel Benson and Mark Kennet. All data are from the World Development Indicators of the World Bank,  worldbank.org

The data in the tables are from the World Bank’s World Development Indicators for 1993 through 2022. GDP is gross domestic product. Time gives the number of years that have passed since 1990, where Time = 1 for 1990. Consumption is personal consumption expenditures. GDP and Consumption are expressed in 2017 and 2015 international dollars, using purchasing power parity.

Wednesday, February 21, 2024

Misery loves saving


                                          Shopping in the Panchshanbe bazaar of Tajikistan.  Photo: Alamy


Tajikistan is the most instable country in an instable region.  It is still smarting from a civil war that killed tens of thousands in the mid-Nineties, amid the chaotic transition to independence and markets from the Soviet era. Figure 2 shows that Tajikistani income halved in three years, from 1993 to 1996, when measured in a way that adjusts for changes in prices and exchange rates.

Remarkably, income has risen steadily ever since, as Figure 2 shows. The global fiscal crisis of 2008 and the pandemic of 2020, barely had visible effects, perhaps because Tajikistan lacks a modern finance sector and is isolated by geography from the rest of the world.  Tajikistan’s economy has even become slightly larger than that of Kyrgyzstan, its northern neighbor prone to small civil wars.

Despite this progress, Tajikistanis have a nagging, puzzling problem. They spend little of the little that they earn.

Over the long run, of another international dollar, they spend only a fifth, as Table 1 shows. They save the rest, either voluntarily or as taxes (which are forced savings). To some extent, this reluctance to spend may reflect an unusual sample of data, always a danger when you’re dealing with Tajikistani records. But as Table 1 also shows, in virtually any sample, the marginal propensity to spend is very likely to be low, ranging from 18 cents to 23 cents on the international dollar.

In contrast, Americans spend more than four-fifths of another international dollar. Russians are similar. Even in Central Asia, where households spend prudently, Kazakhstanis spent two-thirds of another international dollar. (An international dollar is an artificial currency that buys the same amount of, say, a burger, anywhere around the world.)  Tajikistanis are surprisingly frugal.

They need to spend, for they are poor. The income of an average Tajikistani is only one-sixteenth that of an American.  In 2022, it was 4,137 versus 64,703 in 2017 international dollars.  What gives?

One possibility is that life is cheap in Tajikistan. Unskilled workers so abound that many go to Russia to work – 93% of the 720,000 who worked abroad in 2008, reported the International Labour Office. Their earnings were nearly half of Tajikistan’s total income in 2008. This excess supply of labor drives down wages and thus prices in Tajikistan.

Yes, life in Tajikistan is cheap – but leaves much to be desired. In 2021, the typical Tajikistani at birth could expect to live 71.6 years, as compared to 76.3 years in the US and 79.9 years in high-income countries in general. (The American record in life expectancy is a disgrace but fodder for another post.)

Another possibility is that Tajikistanis, having suffered an economic revolution and the most severe civil war in the region, so fear the future that they save for a very stormy day. They don’t save most of their income because they lack things to spend. They save because they fear that someday they will have no income to spend. Their porous southern boundary with Afghanistan, a revolving door for terrorists, may reinforce this fear.

A final possibility is that Dushanbe taxes away too much income for them to have much left to spend. The question is how much money a Tajikistani thinks that she needs to set aside for future taxes. This expectation, in turn, may hinge on the trend in the share of public debt in GDP.

Statistics for this are spotty in the World Development Indicators. The only data for Tajikistan are for 2000 and 2001, 114% and 80%. These are very high numbers. For example, the counterpart figure for Colombia in 2022 was only 70%. But one cannot use 23-year-old data as a reliable guide to expectations formed today. 

More data exist on the GDP share of government expenses – basically operating costs, which include salaries. Tajikistan’s figure in 2021 was 12.5%, far below the world average of 32% (!). Of course, this does not include capital spending on dams and other construction projects, which is important in Tajikistan. But overall the skimpy data provide no reason to think that Tajikistanis save most of their income because they fear high and rising taxes. As a share of GDP, tax revenues rose from 7.7% in 1998 to about 10% in 2004. As of 2021, it was still 10.3%. Yes, these are low tax shares by global standards; the world average exceeds 15%. But they are in line with tax shares elsewhere in Central Asia.  And they certainly do not follow a pattern of falling taxes that would presage an inevitable hike for which Tajikistanis should start to save today.  

Both tables indicate that at a hypothetical income of zero, Tajikistanis consume in both the short and long run. They may borrow from future taxpayers through a government deficit.  Or they may consume out of foreign aid and gifts.

Both tables also suggest that Tajikistanis spend less of the additional dollar in the short run than in the long run, perhaps because they learn over time how to buy durable goods, like autos, that they can postpone. The marginal propensity to consume is .11 in the short run and .2 in the long run.

A final possibility is that Tajikistanis are saving for large families. But in fact, the fertility rate has halved in 40 years; see Figure 6. Families are becoming smaller, so they can't explain why Tajikistanis save so much, unless the cost of family living is growing even faster than families are shrinking.  

The most likely explanation for the Tajikistani reluctance to spend is political uncertainty. There is growing speculation that President Emomali Rahmon will step aside in favor of his son, although he did run for a fifth term in 2020. The next election is in about 2028. The uncertainty does not bode well for an authoritarian government that has been in power since shortly after the nation became independent in 1992.  Misery loves saving, but people don’t love misery. –Leon Taylor, Baltimore tayloralmaty@gmail.com


 Table 1: Long-run consumption function for Tajikistan, 1993-2021

Adjusted R Square

0.902

Standard Error

6.16E+08

Observations

29

ANOVA


Df

SS

MS

F

Significance F

Regression

1

9.86E+19

9.86E+19

259.556

00.0

Residual

27

1.03E+19

3.8E+17

Total

28

1.09E+20


Coefficients

Standard Error

t Stat

P-value

Lower 95%

Upper 95%

Intercept

2.51E+09

2.46E+08

10.207

9.14E-11

2E+09

3.01E+09

GDP

0.201

0.012

16.111

2.26E-15

0.175

0.226


Table 2: Short-run consumption functions for Tajikistan, 1993-2021

Adjusted R Square

0.922

Standard Error

5.5E+08

Observations

29

ANOVA


df

SS

MS

F

Significance F

Regression

2

1.01E+20

5.05E+19

166.845

00.0

Residual

26

7.87E+18

3.03E+17

Total

28

1.09E+20


Coefficients

Standard Error

t Stat

P-value

Lower 95%

Upper 95%

Intercept

2.51E+09

2.19E+08

11.44

0.00

2.06E+09

2.96E+09

GDP

0.111

0.034

3.29

0.003

0.042

0.180

Time

1.04E+08

37060585

2.81

0.009

27926480

1.8E+08


Figure 1: Consumption /GDP ratio for Tajikistan, 1993-2021


Figure 2: Tajikistan GDP, 1993-2021


Figure 3: GDP of Central Asian countries, 2021


Figure 4: GDP of Russia and Central Asian countries, 2021


Figure 5: GDP in Russia and Central Asia, 2021


Figure 6: Fertility rate in Tajikistan, 1960-2021


Notes

All data are from the World Bank’s World Development Indicators.

The data in the tables are from the World Bank’s World Development Indicators for 1993 through 2022. GDP is gross domestic product. Time gives the number of years that have passed since 1990, where Time = 1 for 1990. Consumption is personal consumption expenditures. GDP and Consumption are expressed in 2017 and 2015 international dollars, using purchasing power parity.


References

International Labour Organization.  Migrant remittances to Tajikistan: The potential for savings, economic investment and existing financial products to attract remittance.   obl-eng.p65 (ilo.org)  2010.

Catherine Putz. Tajik President Emomali Rahmon to Seek Fifth Term – The Diplomat.  August 27, 2020

World Bank. World Development Indicators. worldbank.org